
Data Visualization Services at MarqTech
Transform Your Data Into Actionable Insights
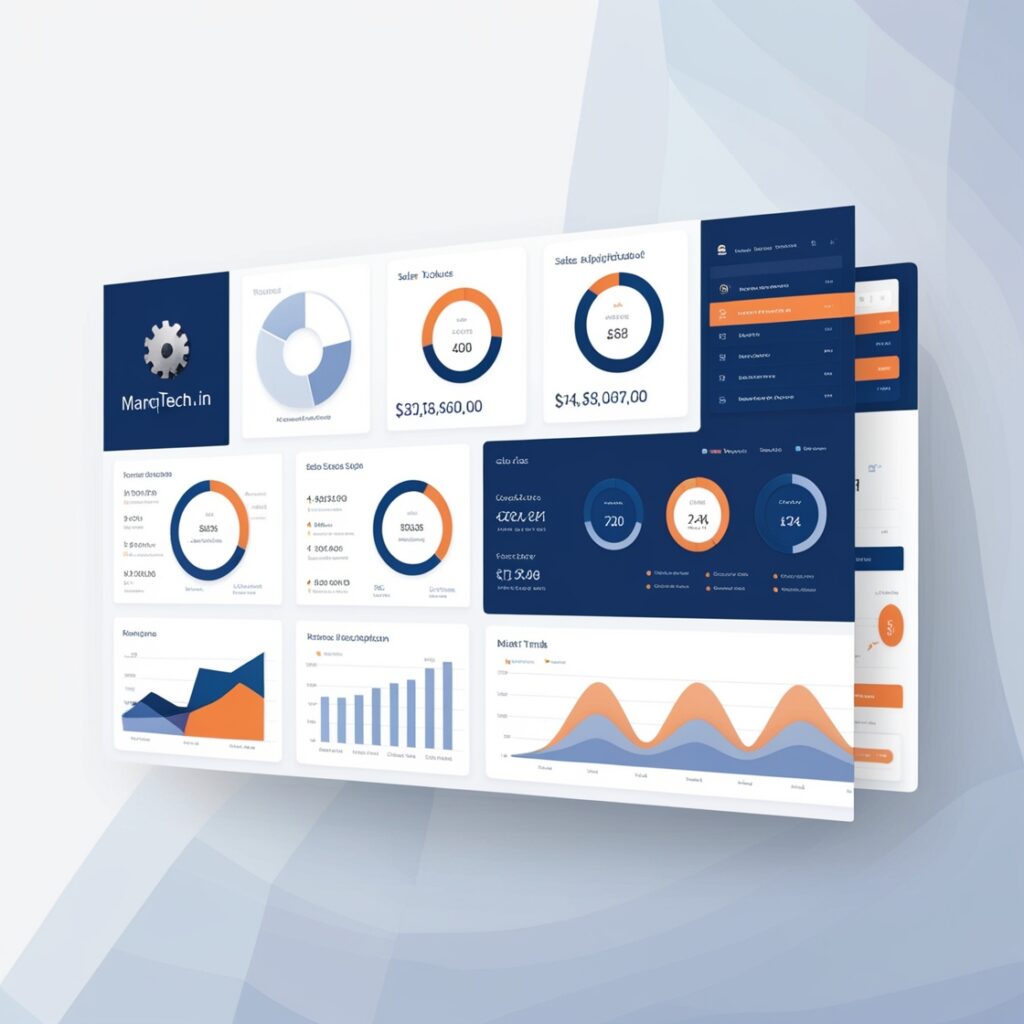
At MarqTech, we specialize in harnessing the power of data visualization to turn complex data into clear, actionable insights. Our AI-powered solutions provide businesses with intuitive and visually compelling ways to make informed decisions and unlock the true potential of their data. Whether you’re looking to streamline operations, enhance marketing efforts, or improve financial planning, data visualization can help you see what matters most.
What Is Data Visualization?
Data visualization is the practice of translating raw data into visual formats, such as graphs, charts, maps, and dashboards. This process simplifies complex datasets, making it easier for stakeholders to identify patterns, trends, and correlations that might otherwise go unnoticed in text-based data.
Why Data Visualization Matters for Your Business
1. Simplifies Complex Data
Complex datasets are often difficult to interpret. Our data visualization tools break down large amounts of data into digestible, visually appealing formats. By transforming numbers into charts, graphs, and dashboards, we make it easier for businesses to grasp difficult concepts quickly.
2. Enhances Data Understanding
Visual formats, such as bar graphs, pie charts, and line graphs, make data more engaging and accessible. With visuals, your team can better understand trends, relationships, and potential opportunities or risks, enabling them to act more confidently.
3. Facilitates Better Decision-Making
Data visualization empowers businesses to make better, data-driven decisions. With real-time visuals, you can identify key insights that inform strategic decisions, helping you improve performance, optimize resources, and achieve business goals.
4. Identifies Trends and Patterns
Seeing patterns and trends is one of the greatest advantages of data visualization. By using visual tools like heat maps, scatter plots, and timelines, businesses can uncover patterns and outliers in their data that may otherwise be overlooked.
5. Improves Communication
Data-driven visuals are more effective at communicating insights than text alone. With data visualization, you can present findings in an easy-to-understand, compelling way, making it easier to persuade stakeholders, clients, and teams.
Key Use Cases of Data Visualization
Business Intelligence
- Sales Performance Dashboards: Track and analyze sales data to identify trends, top-performing products, and forecasts.
- Financial Reporting: Visualize metrics like revenue, expenses, and profits to monitor your business’s financial health.
Marketing Analytics
- Campaign Performance: Measure marketing campaign effectiveness by visualizing metrics such as conversion rates, click-through rates, and ROI.
- Customer Segmentation: Use heat maps and scatter plots to understand customer demographics and behavior.
Healthcare
- Patient Data Analysis: Track patient outcomes, readmission rates, and treatment effectiveness to improve healthcare services.
- Public Health Monitoring: Visualize the spread of diseases, vaccination rates, and other health indicators.
Supply Chain Management
- Inventory Management: Monitor stock levels, reorder points, and inventory turnover rates.
- Logistics Optimization: Visualize transportation routes, delivery times, and shipping costs to optimize logistics operations.
Education
- Student Performance Tracking: Analyze student grades, attendance, and other performance indicators.
- Resource Allocation: Visualize the allocation and utilization of educational resources to improve learning outcomes.
Why Choose MarqTech for Data Visualization?
At MarqTech, we are committed to delivering high-quality, AI-powered data visualization services that give your business the clarity and insights it needs to thrive. Our solutions are tailored to meet the unique challenges of your industry, whether it’s healthcare, finance, marketing, or education.
- Customized Dashboards: Get personalized dashboards and reports that align with your business objectives.
- AI-Driven Insights: Use advanced machine learning algorithms to uncover deeper insights and trends in your data.
- Interactive Reports: Enable stakeholders to interact with data through dynamic reports and visualizations.
- Ongoing Support: We provide continuous support and optimization to ensure your data visualization solutions evolve as your business grows.
Unlock the Power of Your Data with MarqTech
Ready to turn your raw data into valuable insights? MarqTech is here to help you harness the power of data visualization and drive smarter decision-making. Let us help you uncover hidden patterns, improve communication, and stay ahead of the competition.
Contact us today at marqtech.in to get started on transforming your data into a strategic asset.